
Quick Summary
SharePoint BI solutions help organizations transform scattered business data into meaningful insights through the combined power of SharePoint and Power BI. By connecting data sources, centralizing information, and delivering interactive dashboards, businesses can improve reporting accuracy, enhance decision-making, and gain better visibility into operations. When used together, SharePoint and Power BI create a powerful reporting environment that supports collaboration, automation, and data-driven growth.
SharePoint reporting paired with Power BI has become an increasingly important strategy for organizations looking to improve reporting and gain greater visibility into their business operations. Microsoft does not market a specific product called “SharePoint BI.” The term generally refers to using SharePoint as a data source, a collaboration platform, or a reporting portal alongside Microsoft Power BI. Many companies store important information in SharePoint, including project documents, lists, workflows, employee records, and operational data.
This is where Power BI plays a valuable role. Power BI is Microsoft’s business intelligence platform, and it lets organizations connect data sources, build interactive reports, and create dashboards that surface visibility into key performance indicators.
Organizations commonly report against several modern Microsoft 365 data sources beyond SharePoint, including SharePoint Online lists, Microsoft Forms responses, Power Apps data, Dataverse, Teams activity, and Microsoft 365 usage reports.
Reports described as “real-time” depend on the underlying data source, the refresh configuration, and the Power BI licensing tier. Some connections update on a scheduled basis rather than continuously. Organizations should confirm their refresh settings and licensing match the reporting speed they expect.
Our Microsoft SharePoint services enable organizations to centralize information, automate workflows, and improve collaboration across their Microsoft 365 environment.
Understanding SharePoint BI
Business intelligence involves collecting, organizing, analyzing, and presenting data in ways that support decision-making. SharePoint serves as a powerful foundation for business intelligence because it acts as a centralized repository for information across the organization.
Many businesses use SharePoint to manage documents, track projects, store business records, and facilitate collaboration. Over time, these systems accumulate large volumes of valuable operational data.
Power BI builds upon this foundation by transforming raw information into visual reports and dashboards. Rather than manually compiling spreadsheets and reports, organizations can access dynamic visualizations that update automatically as data changes.
How SharePoint and Power BI Work Together
The integration between SharePoint and Power BI simplifies data access and reporting.
Power BI connects to several Microsoft-supported data sources within SharePoint environments, including SharePoint Online Lists, SharePoint Folder, Microsoft Dataverse, SQL Server, Azure SQL, Excel, and Microsoft Fabric. Once connected, Power BI retrieves the information, transforms it into structured datasets, and presents it through interactive dashboards.
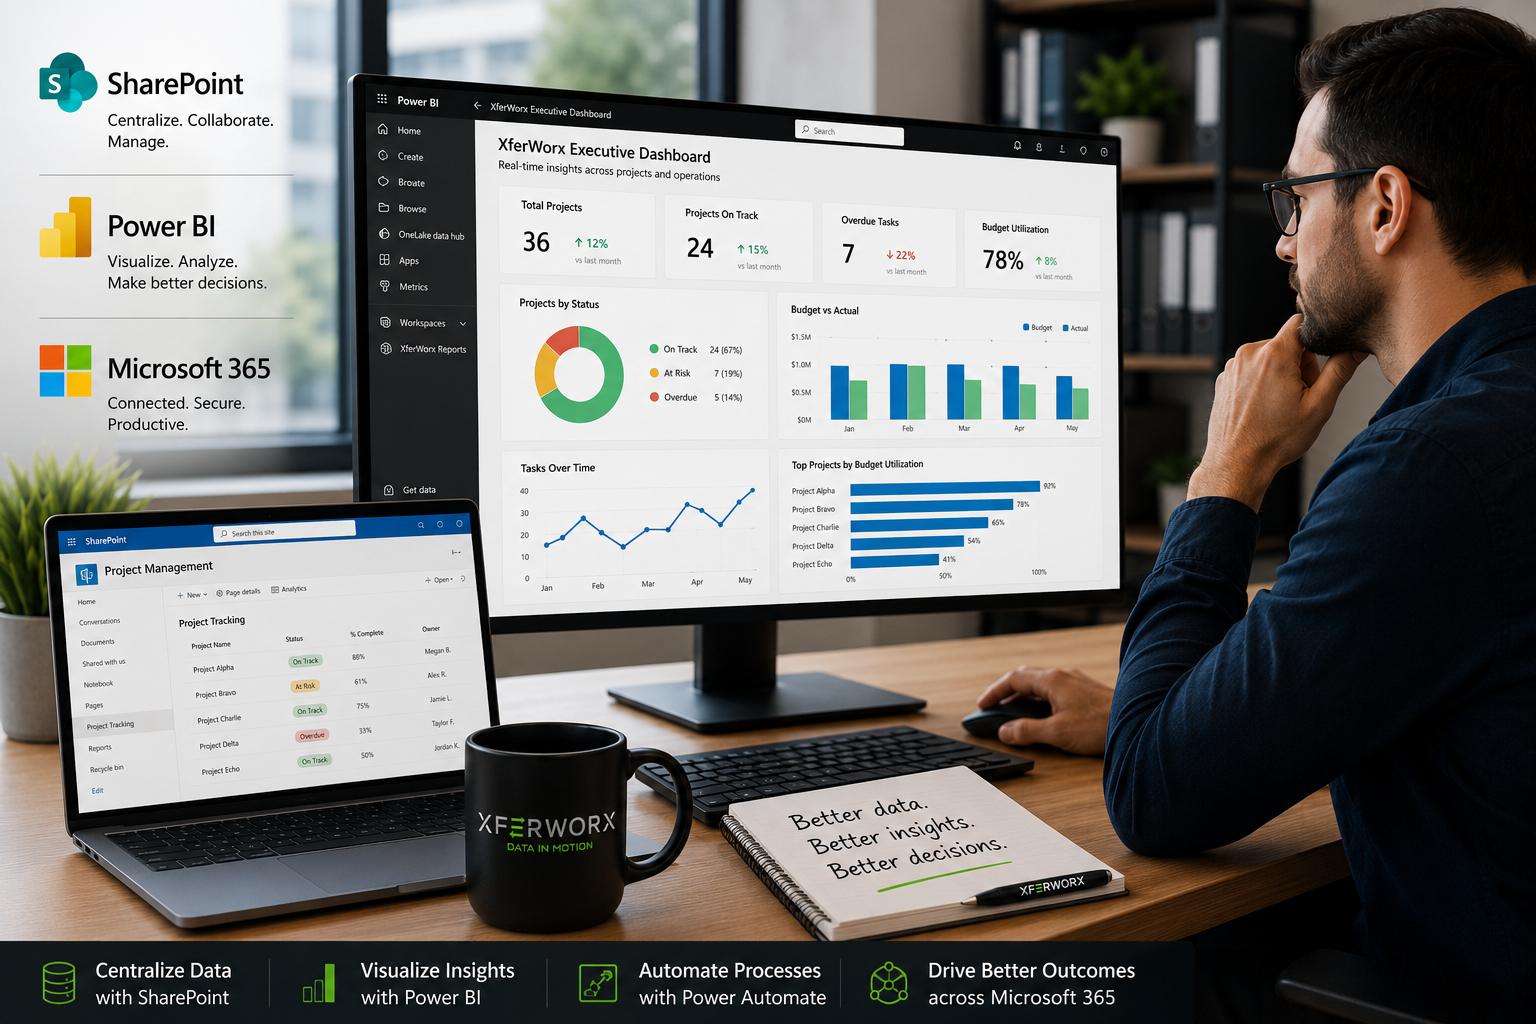
A project management team tracking milestones within SharePoint lists offers a good example. Power BI can use this information to create visual reports showing project progress, budget performance, resource allocation, and upcoming deadlines.
Report refresh frequency depends on several factors, including Power BI licensing, dataset configuration, gateway requirements, and the capabilities of the underlying data source.
Some reports update on a scheduled basis rather than continuously. Organizations should check their configuration to understand how up to date their data will be at any given time.
Improving Data Visibility Across the Organization
One of the biggest challenges organizations face is limited visibility into business data.
Information often exists in multiple systems, departments, and file locations. Employees may spend valuable time searching for information or compiling reports from disconnected sources.
SharePoint helps centralize information, while Power BI helps make that information accessible and understandable.
Executives can view company-wide performance metrics, giving leadership a clear picture of how the organization operates across departments. Operations teams can monitor workflows and resource utilization, including Power Automate workflow performance and the efficiency of automated processes.
Project managers can track progress against objectives by using SharePoint document lifecycle metrics to see how content moves through the review, approval, and completion stages.
Finance teams can analyze budgets and expenditures alongside broader Microsoft 365 usage analytics, linking spending patterns to how the organization uses its tools day-to-day.
IT and compliance teams can also benefit from this reporting by monitoring Microsoft Teams adoption across the organization and reviewing retention compliance reports to confirm that policies are applied correctly.
By presenting data through intuitive dashboards, organizations gain a clearer understanding of business performance and can respond more quickly to emerging opportunities and challenges.
Improved visibility also supports greater accountability by ensuring key metrics are accessible to relevant stakeholders.
Enhancing Decision-Making with Insights
Traditional reporting processes often rely on static spreadsheets and manually generated reports. These methods can create delays and limit the effectiveness of decision-making.
SharePoint BI solutions provide access to information that supports faster and more informed decisions.
Power BI dashboards can update automatically as new data becomes available. This allows leaders to monitor key performance indicators without waiting for periodic reports.
A company migrating to SharePoint Online may track migration progress across multiple sites and document libraries. Power BI can consolidate this information into a single dashboard, allowing management to identify delays, monitor completion rates, and allocate resources more effectively.
Similarly, healthcare organizations, educational institutions, manufacturers, and professional service firms can use SharePoint BI to gain immediate visibility into operational performance.
Access to timely information helps organizations become more agile and responsive.
Streamlining Reporting Through Automation
Manual reporting processes are often time-consuming and prone to human error.
Employees frequently spend hours gathering data, updating spreadsheets, and preparing reports for stakeholders. These activities consume valuable resources that could be directed toward more strategic initiatives.
Integrating SharePoint with Power BI helps automate much of this work.
Data collected through SharePoint can automatically feed into Power BI reports. Dashboards update automatically, reducing reporting workloads and improving data accuracy.
Governance and data quality play a significant role in how well this integration performs:
- Metadata consistency: Consistent metadata across SharePoint lists and libraries determines how easily Power BI can interpret and organize incoming data.
- Content type standardization: Standardized content types keep information organized in a predictable pattern, making it simpler to build reliable reports across multiple sites.
- Information architecture planning: A well-organized SharePoint environment offers Power BI cleaner data, resulting in dashboards that reflect accurate, consistent information.
This automation-first approach aligns with modern digital transformation strategies that focus on eliminating repetitive tasks and improving operational efficiency.
Organizations can generate reports faster while ensuring consistency across departments and business functions.
Automation also improves scalability, allowing reporting systems to grow alongside the business.
Supporting Business Process Improvement
Beyond reporting, SharePoint reporting paired with Power BI can help organizations identify opportunities for process improvement.
Visualizing operational data gives businesses an in-depth understanding of how workflows perform over time. Bottlenecks, inefficiencies, and performance gaps become easier to identify.
An organization managing document approvals through SharePoint document libraries offers a strong example of this in action. A Power Automate approval workflow can route documents to the correct reviewer based on metadata such as department, document type, or priority level. Power BI can then analyze this data in several ways:
- Approval cycle times: Reports can show how long documents spend at each stage of the approval process, from submission to final sign-off.
- Bottleneck identification: Dashboards can highlight where documents consistently stall, such as with a specific reviewer or department that has longer response times.
- Trend analysis: Patterns over weeks or months can reveal whether approval speed improves or declines, helping teams address recurring delays before they affect larger projects.
Organizations can apply this same approach to other areas, monitoring customer service performance, project completion rates, employee onboarding processes, or procurement workflows.
Power BI licensing requirements vary depending on sharing needs, publishing scope, refresh frequency, and the number of people who need to consume reports. Organizations should check current Microsoft licensing guidance before rolling out a reporting solution, since requirements can change and vary by scenario.
Connecting reporting with business process data creates opportunities for continuous improvement and operational excellence. Better resource utilization, reduced costs, and improved organizational performance often follow.
XferWorx supports this work through several specific services:
- SharePoint migrations: Moving content into SharePoint Online with governance in place from the start.
- Power Platform governance: Establishing policies for how Power Automate, Power Apps, and Power BI get used across an organization.
- Microsoft 365 reporting dashboards: Building dashboards tailored to the metrics that matter most to a specific team or department.
- Business process automation: Designing workflows that reduce manual steps and route information to the right people automatically.
- Azure-based reporting solutions: Extending reporting capabilities through Azure services when organizations need additional data processing or storage.
Ready to unlock the power of SharePoint BI and gain better visibility into your business operations? XferWorx helps organizations integrate SharePoint, Power BI, automation, and Microsoft 365 solutions to improve reporting, streamline workflows, and mobilize critical business data.
Contact XferWorx today to discover how a tailored business intelligence strategy can help your organization operate at peak performance.
FAQs
What is SharePoint BI?
Microsoft Teams SharePoint integration connects Teams collaboration features with SharePoint document management capabilities. Files shared in Teams are stored and managed through SharePoint, creating a seamless collaboration experience.
Can Power BI connect directly to SharePoint?
Yes. Power BI can connect directly to SharePoint lists, document libraries, and other SharePoint-based data sources to create interactive reports and dashboards.
What are the benefits of using SharePoint with Power BI?
Organizations can improve data visibility, automate reporting processes, enhance decision-making, reduce manual work, and gain access to business performance information.
Is SharePoint BI suitable for small and mid-sized businesses?
Yes. Small and mid-sized organizations can benefit significantly from SharePoint BI by leveraging existing Microsoft 365 investments to improve reporting and operational visibility without implementing complex enterprise systems.